¶ Introduction
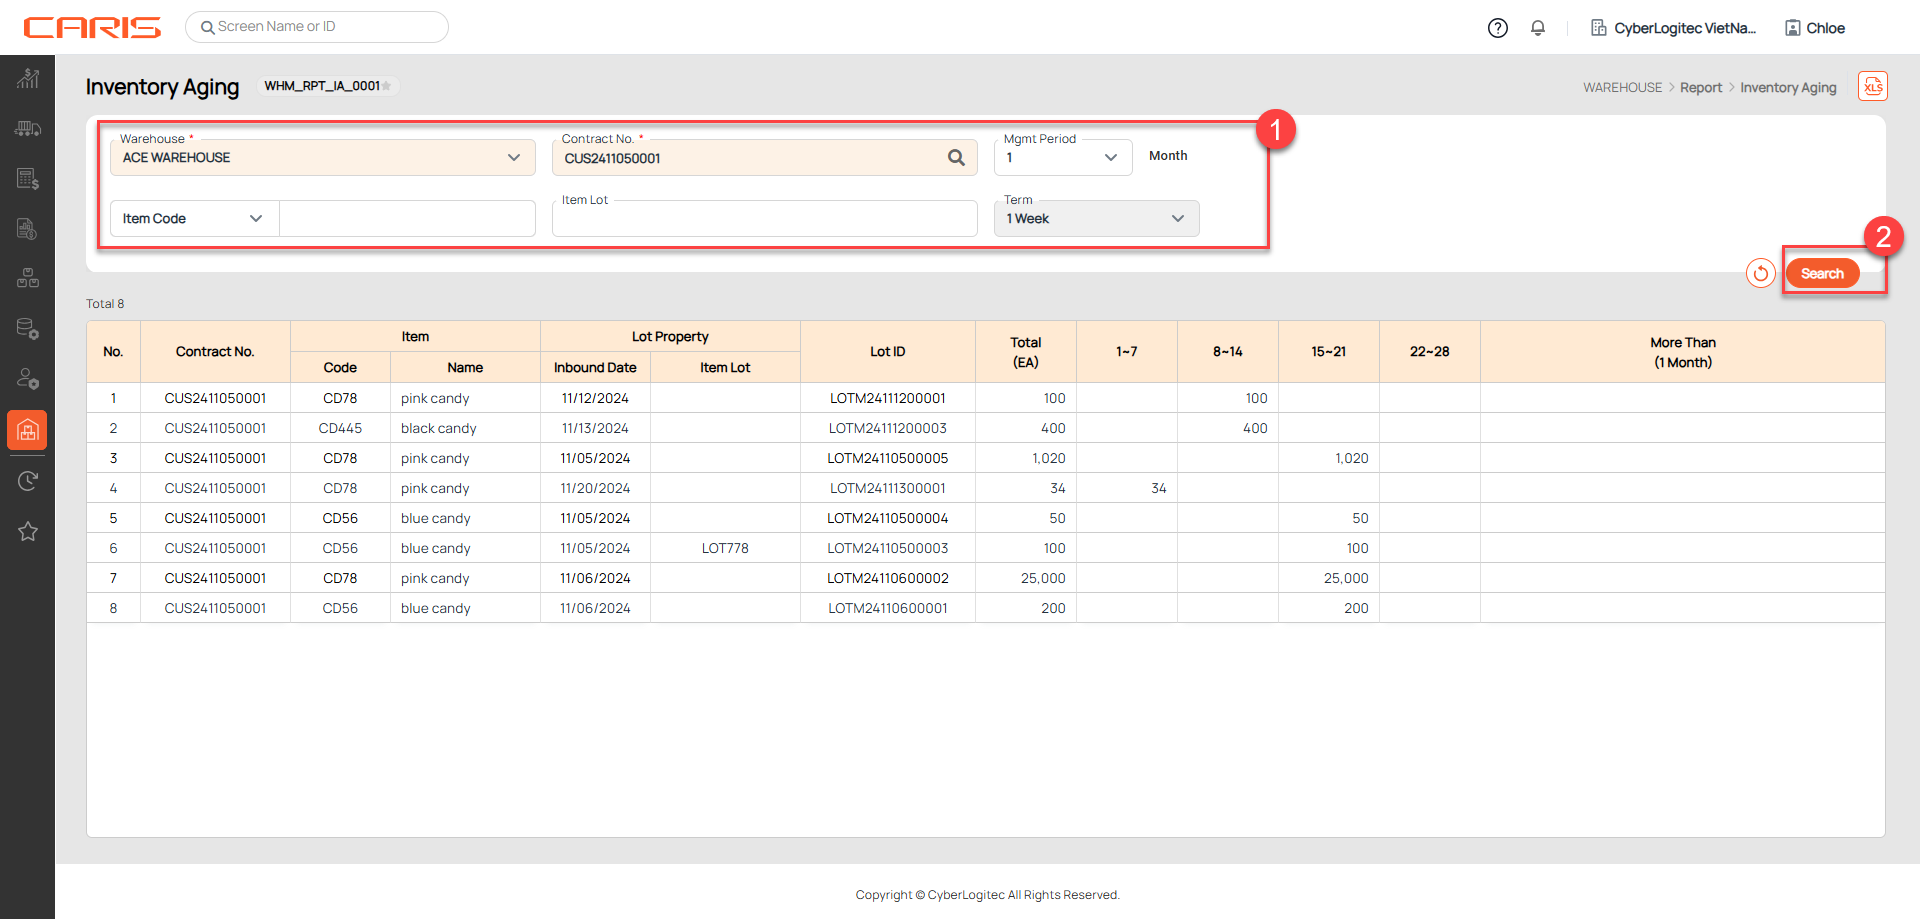
The Inventory Aging UI is designed to display the quantity of inbound inventory, organized by Lot ID, for a period to be selected or specified. This screen helps users monitor the inventory age and take timely action to manage stock effectively.
Navigation: Warehouse > Report > Inventory Aging
Screenshot:
¶ View Inventory Aging Data
Displays inbound inventory quantities categorized by Lot ID. The grid dynamically adjusts columns based on the selected Mgmt Period and predefined Term, allowing users to track inventory aging over specific intervals.
Steps to search:
¶ 1. Enter search criteria
+ Mgmt Period: defines the total time range used for inventory aging analysis. It represents the span of time over which inventory is categorized and analyzed. The system calculates the range starting from the current date and going back to the previous months, based on the Mgmt Period selected by the user.
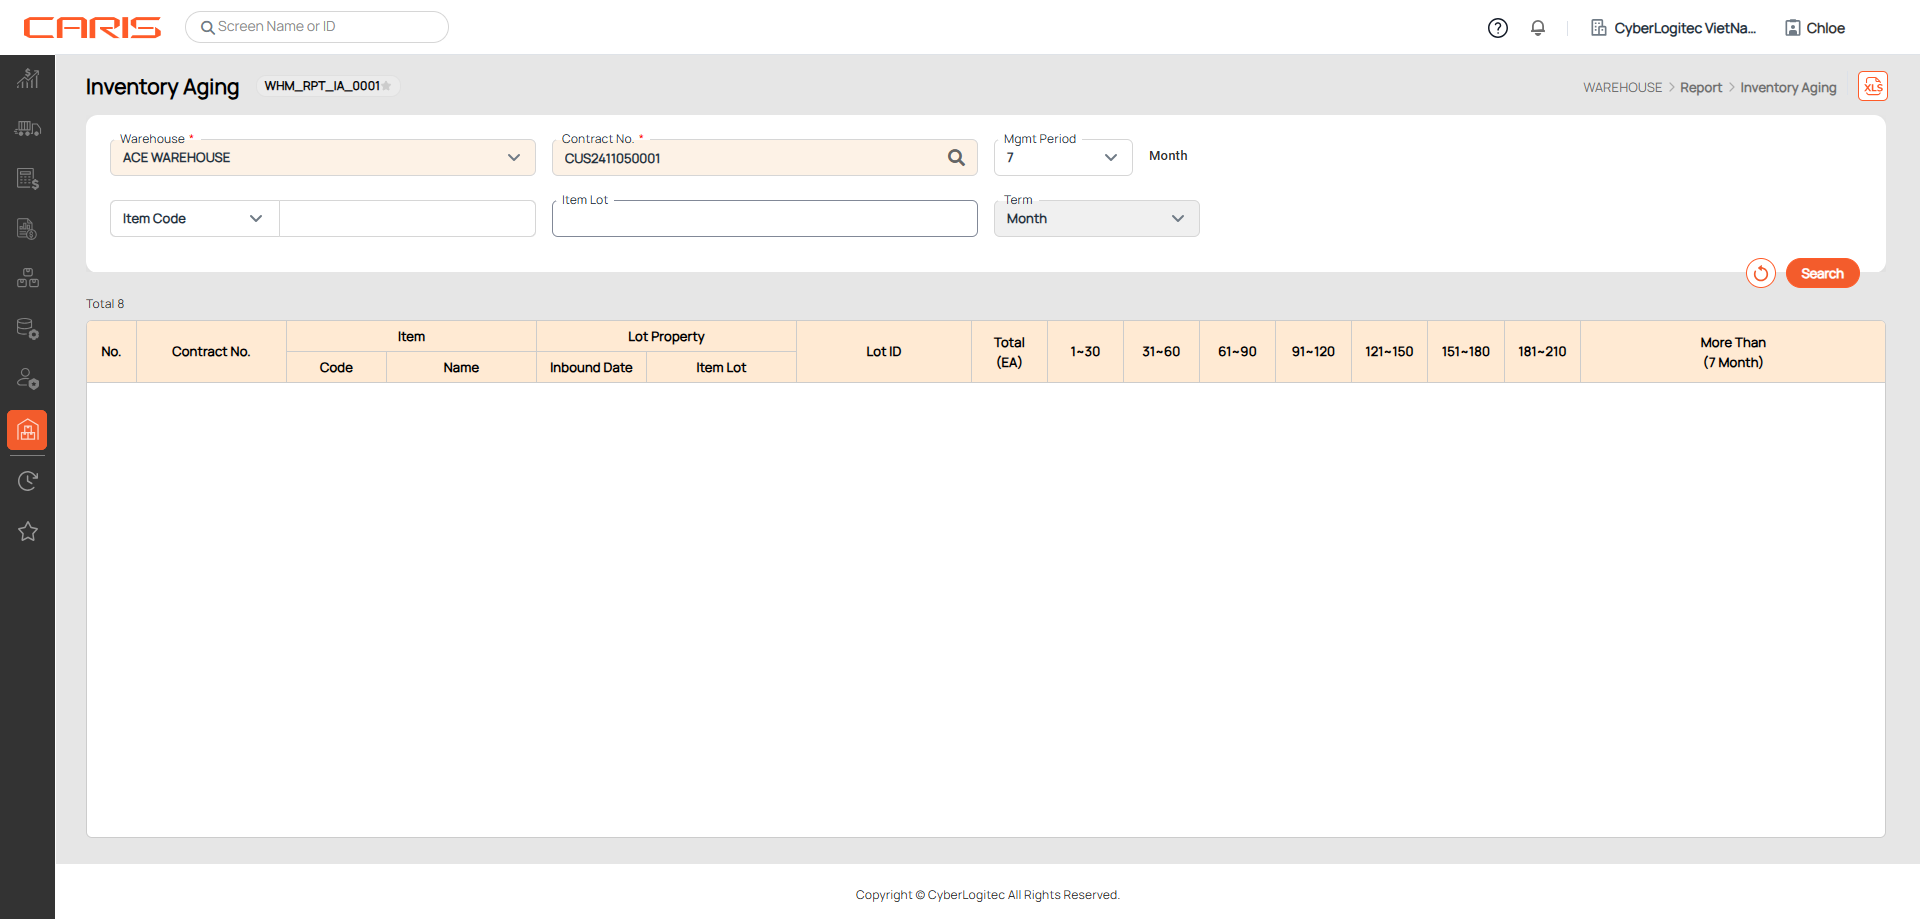
+ Term: The unit of time used to divide the Mgmt Period into smaller intervals for detailed inventory tracking. The division is based on the length of the selected Mgmt Period.
- Note: The system automatically assigns the Term based on the selected Mgmt Period. The Term cannot be manually changed or selected by the user; it is predefined by the system.
- Rule to defined Term:
| Mgmt Period | Term | |
|---|---|---|
| 1 → 3 months | week | 1 week: Inventory data is grouped into 1-week sections. |
| 4 → 6 months | Half Month | Inventory is divided into 15-day sections |
| 7 → 12 months | Month | Inventory data is grouped into 30-day sections. |
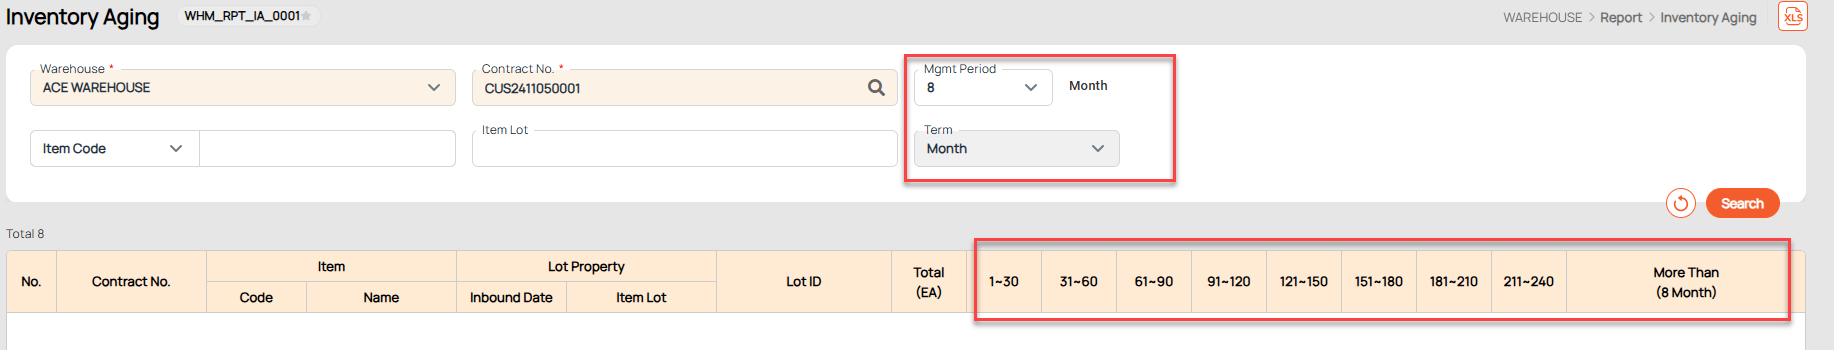
Example of Grid Structure:
| Mgmt Period | Term | Grid Columns |
|---|---|---|
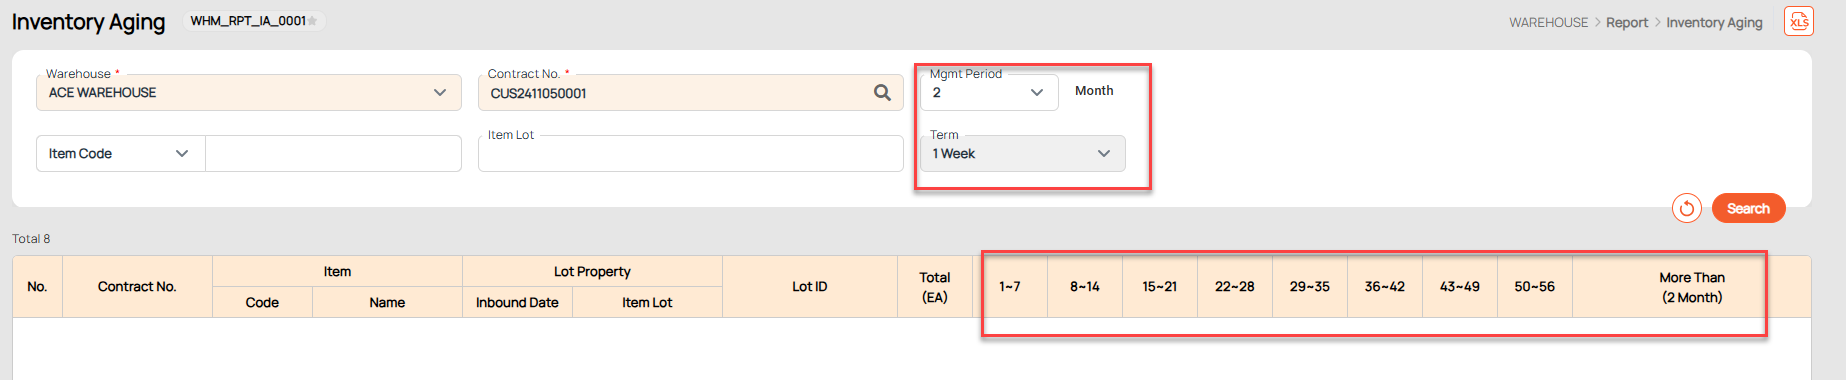
| 2 months | 1 week | 1~7, 8~14, 15~21, 22~28, 29~35, 36~42, 43~49, 50~56, More Than( 2 Month ) |
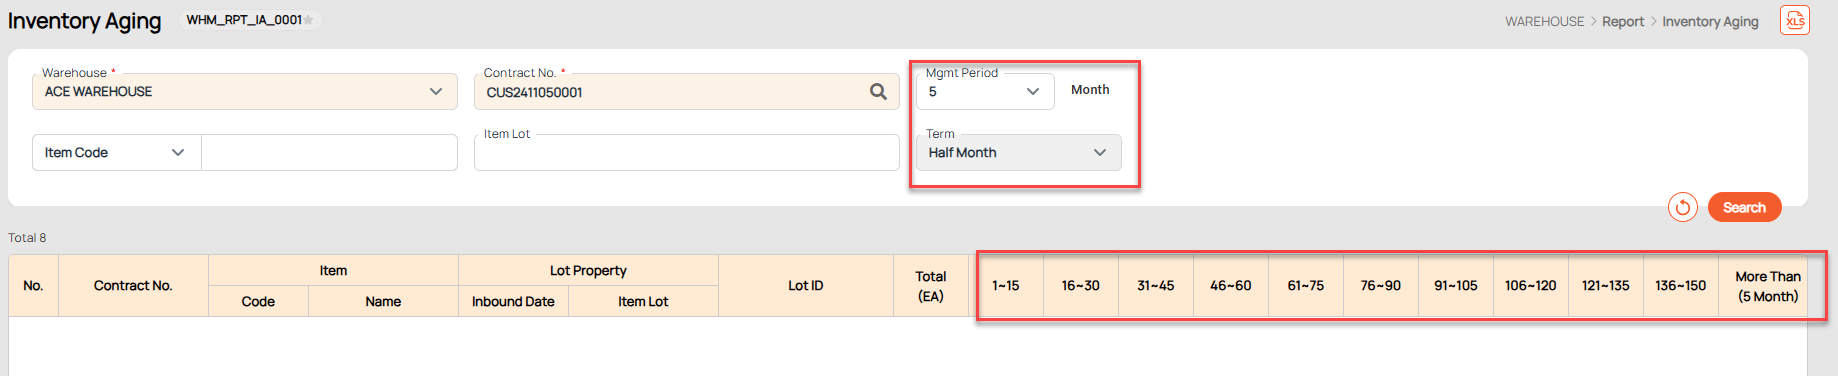
| 5 months | Half Month | 1~15, 16~30, 31~45, 46~60, 61~75, 76~90, 91~105, 106~120, 121~135, 136~150, More Than( 5 Month) |
| 8 months | Month | 1~30, 31~60, 61~90, 91~120, 121~150, 151~180, 181~210, 211~240, More Than (8 Month) |
¶ 2. Click the search button
¶ 3. View results on the grid